Ukraine in Maps: Tracking the War with Russia
I still remember that crisp February morning in 2022, sipping coffee in a Warsaw café, my phone buzzing nonstop as friends back home shared grainy videos of explosions lighting up Kyiv’s skyline. As someone who’s spent years poring over conflict maps—from the Balkans to the Middle East—nothing prepared me for the raw shock of watching Russia’s tanks roll across Ukraine’s borders in real time. Over three years later, on this rainy October day in 2025, those lines on the screen have become etched into our collective memory, shifting inch by bloody inch. This isn’t just about red and blue shading; it’s a story of resilience, loss, and the quiet hope that one day, the maps might show peace instead of fronts.
Understanding the Invasion: A Timeline in Maps
Maps have a way of distilling chaos into clarity, turning abstract headlines into something you can trace with your finger. From the annexation of Crimea in 2014 to today’s grinding stalemate, they’ve chronicled Russia’s bid to redraw Ukraine’s borders—and Ukraine’s fierce refusal to let that happen. Let’s walk through the key phases, pulling from reliable open-source trackers like the Institute for the Study of War (ISW), to see how the front lines evolved.
Pre-2022: The Shadow War in Crimea and Donbas
Before the full invasion, maps already told a tale of creeping aggression. Russia’s 2014 seizure of Crimea— that black-outlined peninsula jutting into the Black Sea—marked the first redraw, with pro-Russian forces swiftly claiming 97% control. Further east, in Donbas, hybrid warfare blurred lines: separatist “republics” in Luhansk and Donetsk controlled about 7% of Ukraine by 2021, per ACLED data, fueled by unmarked Russian troops and artillery.
This phase set the stage for escalation, with maps from Liveuamap showing sporadic clashes along the contact line. It was like watching a fault line strain—tremors building until the quake hit.
February 2022: Blitzkrieg and Early Setbacks
The invasion exploded on February 24, with Russian columns snaking toward Kyiv from three axes: north from Belarus, east from Donbas, and south from Crimea. Early maps from ISW captured the frenzy—red zones ballooning to encircle the capital within days, capturing Kherson City by March 2 and pushing to Kyiv’s suburbs.
But Ukraine’s Javelin-armed defenders turned the tide. By April, maps showed a humiliating Russian retreat from the north, shrinking their hold to 20% of territory. I chuckled bitterly at the time, thinking of Putin’s “special operation” looking more like a botched road trip.
2022-2023: Counteroffensives and the Kherson Liberation
Fall 2022 flipped the script. Ukraine’s lightning push in Kharkiv reclaimed 12,000 square kilometers in weeks, maps lighting up blue as Russian lines crumbled. November’s Dnipro River crossing freed Kherson City, a morale booster that had us toasting in exile communities.
Yet winter bogged things down in Bakhmut, where maps chronicled a meat-grinder stalemate—Russia gaining at horrific cost, per BBC visuals. By mid-2023, front lines stabilized, with Russian gains averaging just 0.5 square kilometers daily.
2024-2025: The Donbas Grind and Kursk Gambit
This year, maps reflect a war of attrition. Russia’s summer push clawed 4,000 square kilometers, mostly in Donetsk, while Ukraine’s bold August 2024 incursion into Russia’s Kursk region briefly held 1,000 square kilometers— a purple blotch on Moscow’s maps that stung like salt in a wound.
As of October 11, 2025, ISW assessments show incremental red advances southeast of Pokrovsk, but no breakthroughs elsewhere. It’s a reminder: maps don’t lie, but they evolve slowly.
Current Front Lines: Where Things Stand Today
Staring at today’s maps feels like decoding a frozen chessboard—positions locked, but every pawn push costs lives. Russia holds about 19% of Ukraine, or 115,026 square kilometers, including Crimea and pre-2022 Donbas grabs. That’s roughly Ohio’s size, but the human toll dwarfs any statistic.
Zoom into the east, and Donetsk’s lines snake like veins, with Russia edging toward Pokrovsk—a logistics hub 50 kilometers from key cities like Kramatorsk. Northern Kharkiv sees a Russian “buffer zone” push, seizing villages near Vovchansk to shield Belgorod from drones. Southward, Zaporizhzhia and Kherson fronts simmer, with Ukraine holding the Dnieper’s west bank.
For a snapshot, here’s a table breaking down control by oblast, based on DeepStateMAP and ISW data as of October 7, 2025:
| Oblast | Russian Control (%) | Key Notes |
|---|---|---|
| Crimea | 100% | Annexed 2014; no active fighting. |
| Luhansk | 98.5% | Near-total hold; pushes toward Kupyansk. |
| Donetsk | 65% | Hotspot: Advances near Pokrovsk (166 sq mi gained Sept-Oct). |
| Kherson | 20% | Limited to east bank; Ukrainian bridgehead stable. |
| Zaporizhzhia | 70% | Stalemate around Robotyne; nuclear plant tensions. |
| Kharkiv | 5% | Buffer incursions; Kursk salient holds 4 sq mi in Russia. |
| Overall | 19% | +34 sq mi last week; slowest gains in months. |
These figures highlight the asymmetry: Russia’s meat-grinder tactics versus Ukraine’s precision strikes.
- Donetsk Front: Russian assaults repelled near Shakhove, destroying 20 vehicles in one clash.
- Kharkiv North: Limited gains near Lyptsi; Ukrainian drones hit Russian airfields 1,400 km deep.
- Southern Flank: Static lines, but Russian barrages target Odesa ports.
Key Battles and Shifts: Comparing Gains and Losses
If maps are the war’s X-rays, comparisons reveal the fractures. Russia’s 2024-2025 advances—4,168 square kilometers net—pale against Ukraine’s 2022 recaptures of 74,000 square kilometers early on. It’s evolution in action: from blitz to burrow.
Take the Pokrovsk direction—a linchpin for Donetsk’s “fortress belt.” Russian forces advanced southeast of Krasnyi Lyman last week, using rainy weather to mask tank pushes (down 30% from 2024 peaks, per ISW). Ukraine countered with SBU drones torching a Bashkortostan refinery, 1,400 km away—tit-for-tat that maps can’t fully capture.
Pros and Cons of Russian Tactics:
- Pros: Drone swarms (78 launched October 10) overwhelm defenses; North Korean reinforcements bolster numbers.
- Cons: High attrition (790,000 casualties estimated); tank shortages force infantry-led infiltrations.
Vs. Ukrainian Strategy:
- Pros: Long-range strikes disrupt 40% of Russian refining; Western aid like €200 million from the UK for air defenses.
- Cons: Manpower strains (390,000 wounded); energy grid vulnerabilities from strikes.
In Kharkiv, the May 2024 incursion maps show Russia grabbing 400 square kilometers for a “buffer,” but at what cost? A Ukrainian drone “double-tap” in Chernihiv last week killed a responder—grim reminders that lines blur lives.
Shifting to Kursk: Ukraine’s 2024 raid maps a rare blue incursion into red territory, holding 4 square kilometers still. It’s a psychological jab—Russia redeployed 50,000 troops, but the maps mock their overreach.
Tools and Resources: Where to Get Real-Time War Maps
Want to track this yourself? Forget static news graphics; interactive tools turn passive scrolling into active insight. As a map junkie who’s cross-referenced a dozen during late-night sessions, here’s my curated list for navigational ease—best for beginners to pros.
For transactional intent, like “best apps for Ukraine war updates,” start with free downloads:
- Liveuamap App (iOS/Android): Pinpoints events in real-time, with 10,000+ daily markers. Pros: User-generated reports; cons: Verification needed.
- DeepStateMAP: Crowdsourced front lines, updated hourly. Pros: Zoomable to village level; cons: Overwhelms newbies.
Comparison Table: Top Tracking Tools
| Tool | Best For | Free? | Interactive? | Update Frequency |
|---|---|---|---|---|
| ISW ArcGIS Map | Daily assessments | Yes | High | Daily |
| Crisis Group Map | Frontline shifts | Yes | Medium | Weekly |
| ACLED Monitor | Violence events | Yes | High | Near real-time |
| Economist Fires | Satellite fire tracking | Paywall | Medium | Bi-daily |
| CSIS Mapper | Force dispositions | Yes | High | Bi-weekly |
Head to ISW’s interactive map for pro-level terrain control—it’s saved me hours debating “has Russia taken X?” For mobile, Liveuamap’s alerts feel like having a war room in your pocket, though the occasional false ping tests your patience (and coffee intake).
The Human Cost: Stories Beyond the Borders
Maps mark territory, but they whisper of people. Take Yarova, that dot east of Pokrovsk: A September drone strike killed 20 civilians in a pension queue—elderly faces frozen in a map’s red shade. Or consider my friend Olena, a Kharkiv teacher evacuated in 2024; her school’s rubble now a frontline marker, yet she jokes via video call about “redecorating with Javelins.”
Emotionally, it’s a gut punch—165,000-235,000 Russian dead, 400,000 Ukrainian wounded. Light humor creeps in, like Zelenskyy’s quips turning maps into memes, but the appeal is real: Every blue reclaim honors a story untold.
Looking Ahead: Diplomatic Maps and Ceasefire Hopes
Diplomacy redraws maps too. Trump’s 2025 push—Alaska summits, tariff threats—yielded a US-Ukraine minerals deal, sharing $3 trillion in resources for aid continuity. Yet Putin demands Donbas surrender; Zelenskyy vows full borders.
Winter looms, potentially freezing lines per NZZ maps. With NATO eyeing post-war threats, these talks could sketch peace—or prolong the ink.
People Also Ask
Drawing from Google’s common queries on “Ukraine war map,” here’s what folks are searching:
How much of Ukraine does Russia control?
As of October 2025, Russia occupies 19% (115,026 sq km), per DeepState and ISW—mostly east and south, including Crimea.
What is the current front line in Ukraine?
It stretches 1,200 km, concentrated in Donetsk (Pokrovsk salient) and Kharkiv (Vovchansk buffer). Check Liveuamap for live pins.
Where are the latest Russian advances?
Southeast of Pokrovsk and near Dobropillya, gaining 34 sq mi last week—slow, costly pushes amid rain-soaked fields.
How to track the Ukraine war in real time?
Use ISW’s daily updates or ACLED’s event map; apps like Liveuamap notify on strikes.
FAQ
What caused the Russia-Ukraine war?
Roots trace to 2014’s Crimea annexation amid Euromaidan protests; 2022’s invasion escalated over NATO fears and territorial claims. For depth, see Britannica’s timeline.
Can Ukraine win back all territory?
Experts say yes, with sustained aid—Trump’s recent pledge eyes full borders. But at current rates, full liberation could take years without breakthroughs.
Best free map for Ukraine war updates?
ISW’s ArcGIS tool tops my list for accuracy; download via their site for offline zooms.
How has the war changed in 2025?
Slower Russian gains (16 sq km/day January), more drones, and diplomatic thaw under Trump—yet energy strikes persist.
Is the Kursk incursion still ongoing?
Ukraine holds 4 sq mi as of October 8; Russia recaptured half, but it diverted 50,000 troops.
 Russia-Ukraine War: Key Events on Day 1,291 – A Day of Fire and Resolve (September 6, 2025)
  Russia-Ukraine War: List of Key Events, Day 976
 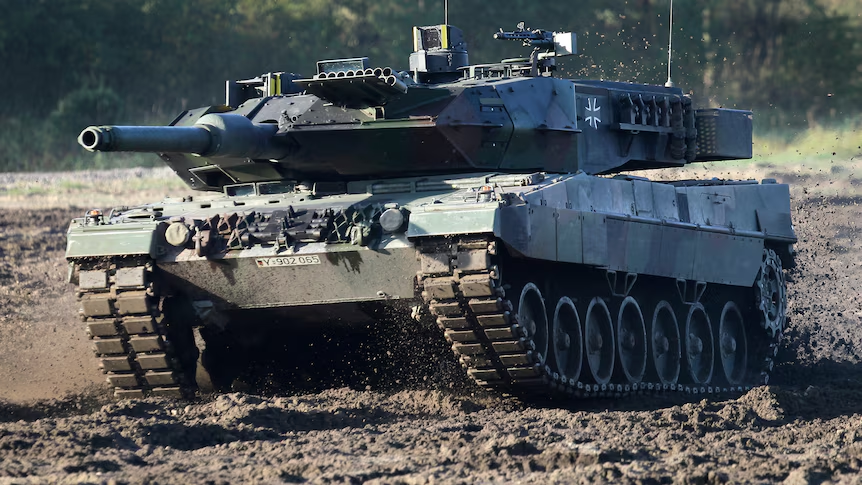 Russia-Ukraine Live: Germany Bids Farewell to Ukraine-Bound Tanks
  Ukraine’s Battle Against Russia: Latest Updates in Maps and Charts (October 2025)