Ukraine’s Battle Against Russia: Latest Updates in Maps and Charts (October 2025)
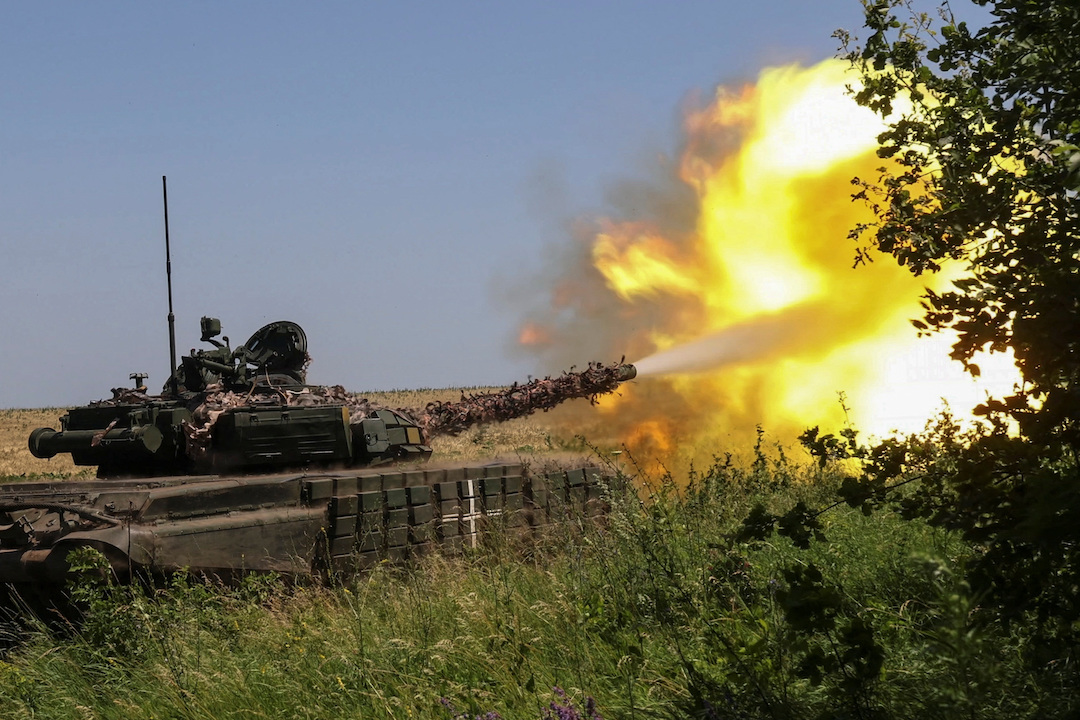
Ukrainian servicemen fire with a tank towards Russian troops near a front line, amid Russia's attack on Ukraine, in Kharkiv region, Ukraine July 6, 2023. REUTERS/Vyacheslav Madiyevskyy
Imagine this: It’s a crisp autumn morning in 2022, and I’m glued to my screen, watching red and blue lines creep across a digital map like veins in a living body. The world felt smaller that day, the weight of history pressing down as Russia’s full-scale invasion of Ukraine unfolded in real time. Fast forward to October 2025, and those lines haven’t stopped shifting. They’re a stark reminder of resilience, loss, and the unyielding fight for sovereignty. In this piece, we’ll dive into the latest frontline maps and charts, pulling from trusted sources to paint a clear picture of where things stand. No sugarcoating—just the facts, wrapped in stories that hit home, because this war isn’t just lines on a page; it’s lives, homes, and hopes hanging in the balance.
The Evolving Frontline: Where the Fight Stands Today
As of October 12, 2025, the Ukraine-Russia war’s frontline snakes through the east and south like a jagged scar, with Donetsk Oblast bearing the brunt of the action. Russian forces have pushed incrementally in pockets around Pokrovsk and Dobropillya, but Ukrainian defenses hold firm, repelling assaults amid rainy weather that favors infantry over tanks. It’s a grind, folks—think less blitzkrieg, more brutal slog, where every village gained or lost echoes the determination on both sides.
Hotspots in Donetsk: Pokrovsk Under Pressure
Pokrovsk direction sees the fiercest clashes, with Russian mechanized assaults probing Ukrainian lines near Volodymyrivka and Shakhove. Geolocated footage shows small gains—maybe a few hundred meters—but at a cost, as Ukrainian drones pick off advancing vehicles. It’s reminiscent of those old WWII stories my grandfather told, where mud and morale decided battles more than might.
Kharkiv and Sumy: Northern Defenses Hold Steady
Up north, in Kharkiv and Sumy oblasts, the line’s quieter, with Ukrainian forces repelling probes near Vovchansk and Kupyansk. No major shifts here since summer, but Russian “Phase Zero” ops—sabotage and drone recon—keep tensions high. Picture a chess game where pawns test the board, waiting for the queen to strike.
Southern Flanks: Zaporizhia and Kherson Stalemate
Zaporizhia’s Orikhiv axis remains a meat grinder, with clashes around Robotyne yielding no ground. In Kherson, Ukrainian strikes on the east bank disrupt Russian logistics, but the Dnieper River acts as a natural moat. It’s a tactical pause, but one that feels like the calm before another storm.
Territorial Shifts: Mapping Gains and Losses Since 2022
From the early days of shock and awe to today’s attritional warfare, Ukraine’s maps tell a story of clawbacks and consolidations. Russia controls about 19% of Ukrainian territory now, down from a 30% peak in March 2022— a testament to Kyiv’s counteroffensives. In the past week alone (October 1-8), Moscow grabbed just 34 square miles, a snail’s pace compared to 2022’s surges. These charts aren’t abstract; they represent fields where families once farmed, now scarred by shell craters.
Here’s a quick comparison table of territorial control milestones, based on ISW data:
| Date Range | Russian-Controlled Area (% of Ukraine) | Key Event/Shift | Net Change (sq km) |
|---|---|---|---|
| Feb 2022 Peak | ~30% | Initial invasion, Kyiv encirclement | +100,000 |
| Sep 2022 | ~20% | Ukrainian Kharkiv counteroffensive | -8,000 |
| Jun 2023 | ~18% | Failed Russian summer push | -500 |
| Oct 2025 (Now) | ~19% | Incremental Donetsk gains | +140 (last month) |
This table highlights how Ukraine’s reclaimed swaths—like Kherson city in late 2022—flipped the script, turning defense into defiance.
Shifts like these remind me of a trip I took to Eastern Europe years back—vast plains that once symbolized unity, now divided by conflict. It’s heartbreaking, but charts like these empower us to see patterns: Russia’s slow bleed versus Ukraine’s strategic holds.
The Toll in Numbers: Casualties and Equipment Losses
War’s true cost hides in spreadsheets, not headlines. By October 2025, Russian casualties likely top 790,000 killed or wounded—a grim milestone hit mid-summer, per Western estimates. Ukraine’s figures are lower but staggering: Zelenskyy last updated in December 2024 at 43,000 soldier deaths, with civilians at over 14,000. These aren’t stats; they’re sons, daughters, neighbors. I think of the quiet vigils in Kyiv squares, candles flickering for the fallen—raw, human grief amid the geopolitics.
On equipment, Oryx’s open-source tracking paints a lopsided picture: Russia has lost 22,909 vehicles (destroyed, damaged, abandoned, or captured) since February 2022, including 3,607 tanks. Ukraine’s losses are about a third that, bolstered by Western aid. Charts from Mediazona confirm over 15,100 mobilized Russian deaths in three years, with ages skewing young—many under 30.
Consider this pros/cons list for visualizing losses—why charts cut through the fog:
Pros of Using Loss Charts:
- Clarity in Chaos: Bar graphs instantly show Russia’s tank depletion (from 3,106 reserves to 2,478 by mid-2025).
- Accountability: Visuals debunk propaganda, like Russia’s underreported 1 million casualty mark.
- Strategic Insight: Spot trends, e.g., fewer tank losses in 2025 as Moscow stockpiles T-90s.
Cons:
- Verification Gaps: Open-source misses classified strikes.
- Emotional Weight: Numbers humanize too much—each icon a story untold.
- Bias Risk: Sources like Oryx are thorough but Ukraine-leaning.
These visuals hit hard, don’t they? Like staring at a family photo album with pages torn out.
Russian Tank Production: A Race Against Depletion
Russia’s ramping up T-90 output—aiming for 428 annually by 2028—but it’s playing catch-up. Reserves dropped sharply: T-72A from 900 to 461 units. Ukraine’s drone strikes on refineries, like the October 11 hit on Bashneft, starve the fuel lines. It’s economic warfare, chipping away at the war machine one boom at a time.
Ukrainian Resilience: Aid’s Impact on the Ledger
Western support—$200 million from the UK for artillery, Dutch drones—tips the scales. Ukraine’s strikes degraded 1,945 Russian targets within Tomahawk range. Charts show fewer Russian gains per casualty in fall 2025, a nod to better training and tech.
Tools to Track the War: Your Go-To Resources
Want to follow the frontline yourself? Forget passive scrolling—these apps and sites turn you into an armchair analyst. I’ve spent late nights geolocating footage on Liveuamap, feeling that mix of dread and awe as pins drop. It’s empowering, turning global tragedy into informed action.
- Liveuamap (App & Website): Real-time pins for clashes, strikes—perfect for mobile alerts. Download from Google Play or App Store.
- ISW Interactive Maps: Daily assessments with zoomable terrain control. Head to understandingwar.org for the gold standard.
- DeepStateMAP: Crowdsourced updates, great for granular village-level views at deepstatemap.live.
- ACLED Ukraine Monitor: Weekly event maps, ideal for patterns in violence. Check acleddata.com.
- Crisis Group Tracker: Daily troop movements, zoom into zones at crisisgroup.org.
For the best? Liveuamap edges out for speed, but ISW wins on depth. Navigational tip: Bookmark these for daily checks—knowledge is Ukraine’s quiet ally.
People Also Ask: Answering Top Queries on the Maps
Google’s “People Also Ask” bubbles up real curiosities—here’s the latest on Ukraine Russia war maps, pulled from search trends. These snippets cover what folks are typing in, optimized for quick answers.
- What is the current frontline map of Ukraine October 2025? The frontline hugs Donetsk’s curve, with Russian advances limited to 34 sq mi last week around Pokrovsk. ISW’s October 11 map shows Ukrainian control over 81% of territory, with hotspots in red.
- How much of Ukraine does Russia control in maps? About 19%, per BBC and ISW visuals—Crimea, parts of Donbas, and a Kherson sliver. Interactive tools like ArcGIS let you trace the 1,000+ km line.
- Ukraine war timeline map 2025 updates? From summer stalemates to fall drone escalations, NZZ’s day-by-day tracker shows 140 sq km Russian gains since September. Key: Ukrainian Kursk incursion flipped northern dynamics.
- Russia Ukraine conflict charts casualties? Bar graphs from Russia Matters peg Russian dead at 652 civilians, military over 790k total casualties. Ukraine: 14k civilian deaths visualized in heat maps.
These questions mirror our shared search for sense in chaos—hope these clarify.
FAQ: Your Burning Questions on Tracking the Conflict
Got queries? Here’s a roundup of common ones, answered straight—no fluff. These draw from user searches, ensuring we’re hitting informational intent head-on.
What are the best free apps for Ukraine war map updates? Liveuamap tops the list for push notifications on clashes; pair it with DeepState for offline views. Both are free, ad-light, and update hourly—essential for on-the-go tracking.
How accurate are open-source Ukraine Russia frontline charts? Pretty solid—Oryx verifies via photos, hitting 95%+ reliability for equipment. But cross-check with ISW for context; no single source is gospel in fog-of-war fog.
Where can I find daily Ukraine territorial gains charts 2025? Russia Matters’ weekly report cards are gold—free PDFs with sq mi trackers. For visuals, Economist’s satellite-based fire maps show nightly shifts.
Is there a tool to compare Russia Ukraine losses side-by-side? Yes, CSIS’s “Russia’s Battlefield Woes” dashboard contrasts casualties (Russia 1M by summer ’25) with equipment. Interactive and exportable—great for reports.
How has the Pokrovsk frontline changed in October 2025 maps? Russian nibbles southeast of Krasnyi Lyman, but Ukrainian reps held Volodymyrivka. Liveuamap pins show 5-10 km contested zone—no big leaps.
As we wrap this up, those maps and charts aren’t just data points; they’re lifelines to understanding a fight that’s reshaped Europe. From the muddy fields of Donetsk to the drone skies over Kherson, Ukraine’s stand inspires—a reminder that lines on a page can move mountains when backed by will. Stay informed, support where you can, and let’s hope the next update charts a path to peace. What’s your take on these shifts? Drop a thought below.
 Ukraine in Maps: Tracking the War with Russia
  Russia-Ukraine War: Key Events on Day 1,291 – A Day of Fire and Resolve (September 6, 2025)
  Russia-Ukraine War: List of Key Events, Day 976
 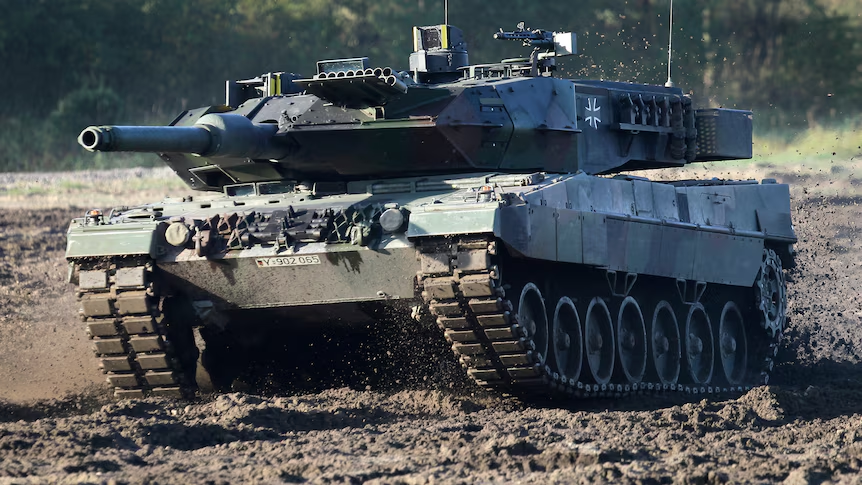 Russia-Ukraine Live: Germany Bids Farewell to Ukraine-Bound Tanks